Scrollmation
A fixed frame, narrative beats moving beside it.
Examples · every section, live
Every block on this page is a real Tellframe section, rendered exactly as a reader would see it. Scroll through them, then read the flagship investigation end to end.
Section catalogue
A fixed frame, narrative beats moving beside it.
A directional wipe between two states of one frame.
Photography or looping video with placed text.
Bars, lines and areas that build on arrival.
Figures that count up as the reader reaches them.
Locations searched from a real gazetteer, auto-placed.
Diagrams assembling one link at a time.
Portrait, pull quote and audio in one movement.
Two stacks of blocks, side by side.
Contact sheets, grids and captioned strips.
Flourish, Datawrapper, YouTube, Spotify, X, Instagram.
A vertical 1080×1920 scroll-through for every story.
Example 01
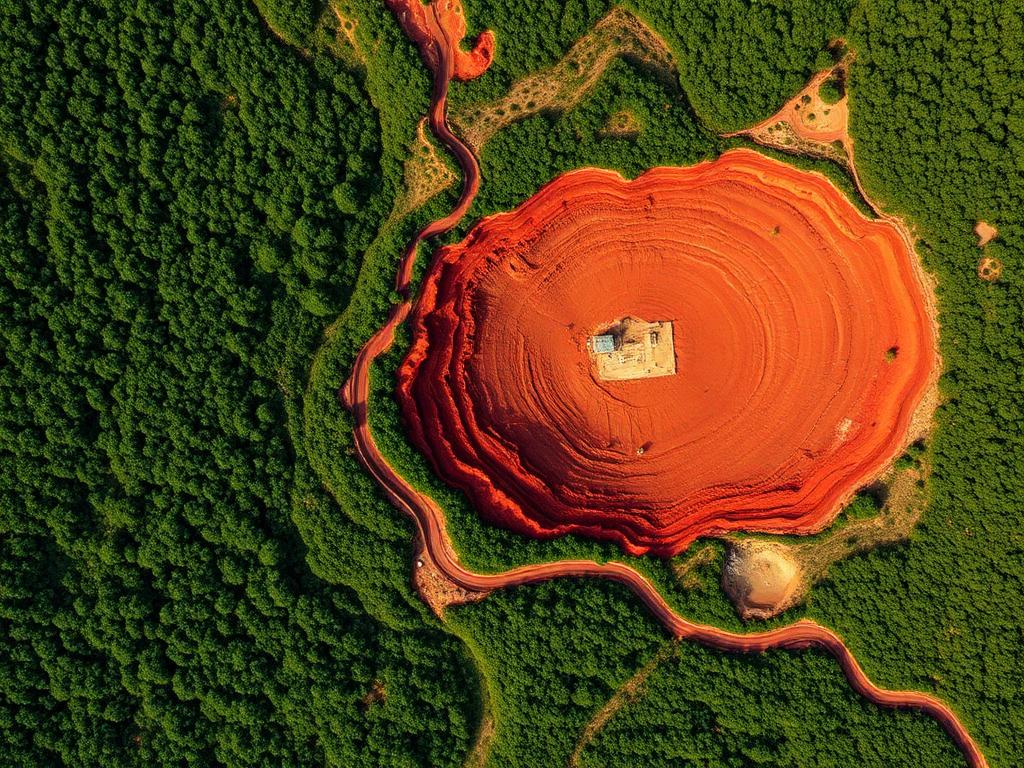
The visual pins to the viewport while the narrative advances beside it. Satellite passes, diagrams, timelines — anything that gains meaning from sequence.


Four satellite passes over one Sulawesi catchment, 2018 to 2026.
The concession boundary existed only on paper. Canopy cover across the valley measured 96 percent, and the river ran clear enough to drink from.
An eleven-kilometre haul road crossed the catchment in a single dry season. Within months, residents reported wells running dry for the first time in living memory.
Overburden stripping began at the head of the valley. Successive satellite passes recorded the forest line receding by close to four kilometres in eighteen months.
The mine now covers 412 hectares. Sediment loads downstream are eleven times the pre-2018 baseline, and two fishing hamlets have relocated upriver.
Example 02
Two frames of the same coordinates, wiped against each other by the reader's own scroll.
Forest cover across the concession, before and after.
Example 03
Native chart sections in seven styles and four palettes, or bring Flourish and Datawrapper straight into the flow.
Indonesian nickel output, million tonnes
Sediment load index, downstream
Source captions, caveats and alt text travel with every chart, so the data survives the copy edit.
Example 04
Big-number blocks count up on entry, so the scale of a finding lands before the sentence explaining it.
0 ha
Mine footprint today
0×
Sediment load vs. baseline
0%
Canopy cover in 2018
0
Hamlets relocated upriver
Example 05
Each link appears in turn as the reader scrolls, following the ore from pit to showroom.
Morowali, Sulawesi
Industrial park, Bahodopi
Jiangsu, China
Assembly, Europe & North America
Example 06
Interview audio sits inside the narrative rather than above it, next to the portrait and the pull quote it belongs to.

“The river told us first. We stopped drinking from it two dry seasons before anyone came to measure.”
Maria Santos · riverside hamlet, Morowali
Demonstration portrait · Wikimedia Commons
Listen to the testimony
Example 07
Each column takes its own stack of text, media, quotes, numbers, tables and embeds — with per-block width, alignment and mobile visibility.
Column A · narrative
The concession covered 6,400 hectares. Only 900 were ever assessed for downstream impact, and the assessment predates the haul road entirely.
Column B · evidence
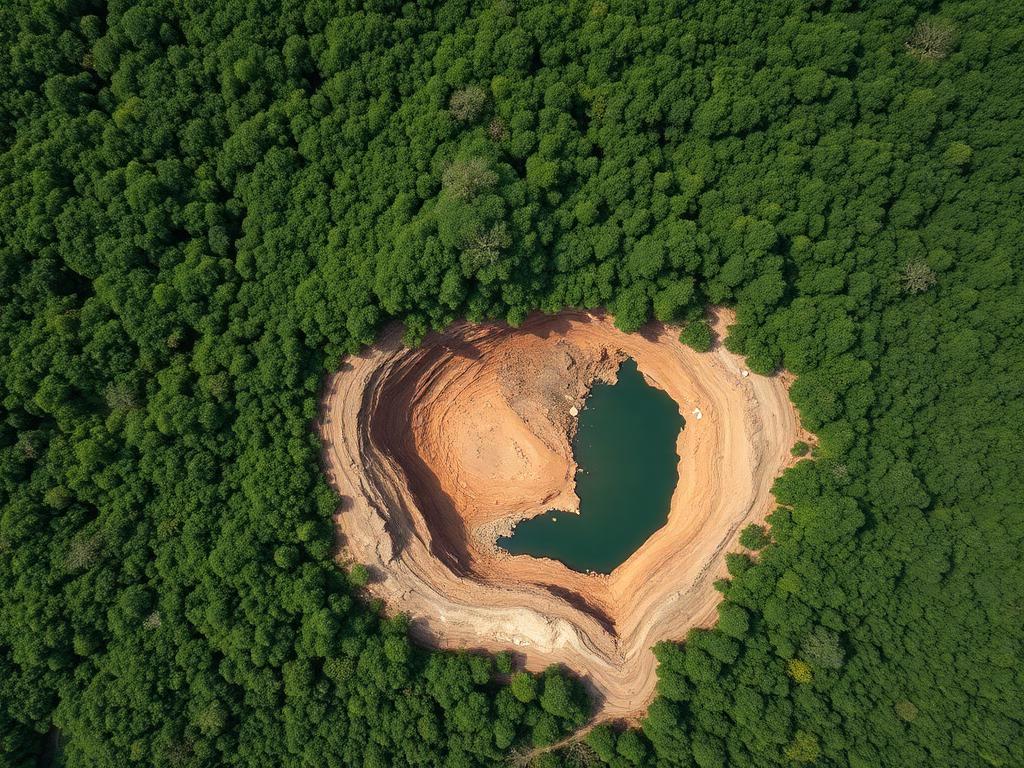
Sediment pond visible at the head of the valley, 2022
Example 08
Captioned grids and strips for photo essays, document scans and archive material.
Example 09
Search a real place database and Tellframe fills coordinates, zoom and label. Anything else — Flourish, Datawrapper, YouTube, Spotify, X, Instagram — drops in by URL.
Morowali, Central Sulawesi
Templates
Every template ships with a section skeleton and a background you can swap for your own photograph or a looping video.
Image background
Evidence-led feature with satellite scrollmation and documents.
Image background
Dispatch structure: place, people, findings, next steps.
Image background
Charts that build as the reader scrolls, with plain-language beats.
Video background
Full-screen looping video hero, then a quiet reading column.
Image background
Photography first: full-bleed frames with captions between.
Image background
CRI-branded impact report: year in numbers, evidence, voices, accountability asks.
Video background
CRI accountability launch: manifesto hero, three asks, evidence, signup.
Image background
One person, told through portraits, audio and quotes.
Video background
Document-led exposé with evidence viewer, timeline and redaction reveals.
Video background
Chapter-by-chapter journey where the map flies between scrollpoints.
Image background
Multi-chart analysis with side-by-side comparisons and methodology notes.
Image background
Client-ready impact narrative with branded theme, testimonials and conversion CTA.
Your next story deserves more than another article template
Ready when you are
Build an immersive visual story, publish it anywhere and turn it into social video—all without writing code.
Example 10
A vertical cut for social
Every published story exports a 1080×1920 scroll-through video for Instagram and LinkedIn, generated in the browser from the story itself.
Tellframe
The Price of Nickel
- · 1080×1920, ready for Reels, Stories and LinkedIn video
- · Uses your own frames, headline and brand colour
- · Generated client-side — nothing leaves the browser
- · Re-export whenever the story changes
Try it on your story